US Dollar Talking Points:
Currencies are unique in that they’re relative. For Americans such as myself, this can be a vexing proposition, especially when getting started with FX. Because Americans often learn of equity markets before FX, many tradeable assets feel binary in nature. If you like Apple, you buy it. If you don’t, you don’t. If you really don’t, well you can also short it, but your decision on Apple is largely ‘buy, sell or do nothing.’
In currencies – the choice is much more nuanced. Don’t like the Euro? Ok, well you have a number of ways of selling it and multiple currencies that you can use to pair up the trade. But, the important point is:
Because currencies are the base of the financial system – the only way to value a currency – is with another currency.
And for the US Dollar, this is key, as DXY is merely a composite of a number of other currencies all contributing to the value of the US Dollar. As I often point out, the Euro is 57.6% of that DXY quote, so its not often that the Dollar will make a move without at least some counter-participation from the Euro, and that’s what we have showing right now. US Dollar strength is most definitely a dominant theme, but more recently, this seems to be a Euro story, which I’ll discuss in deeper detail below. And, if you’d like to read more about what goes into FX pricing and what pushes currencies, check out this article from DailyFX Education on The Nucleus of the Forex Market.
The US Dollar
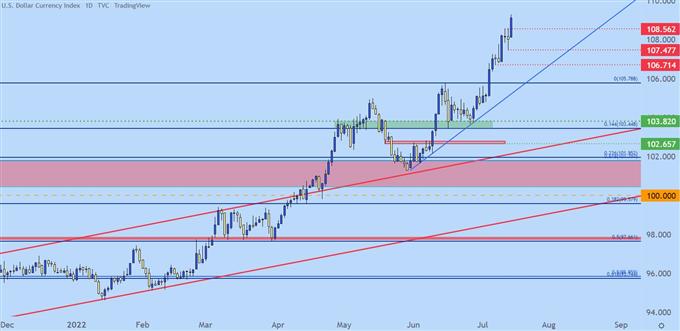
The USD has recovered all of yesterday’s pullback and then some, now sitting at a fresh 19-year-high. I’ve kept the technical forecast at bullish for a while on the USD and I often get the question of how far this move might run.
I do not know, and I don’t want to try to call a top on something that’s still in a full-scale surge. There’s no evidence of a top yet, as far as I’m concerned. But, also such as I discussed yesterday, patience for these trends is key and waiting for a pullback, such as we had yesterday, is the often the more productive way of approaching the matter. It’s much better than just triggering and, hoping, that it’ll work out. Hope is a terrible trading strategy.
US Dollar support potential exists at a few possible spots, and traders can move forward as aggressively as they see fit. For those that are looking for a small pullback, there’s a spot at 108.56 that’s of interest. Below that, yesterday’s low syncs up with psychological support around 107.50. And below that, 106.71 is of interest.
US Dollar Daily Price Chart
Chart prepared by James Stanley; USD, DXY on Tradingview
EUR/USD Parity Breach
Yesterday, in the immediate aftermath of that CPI print with USD pulling back, it was clear that it was more of a EUR/USD theme as the pair was getting a bounce off of parity.
Parity is the ultimate psychological level and in many cases, a level of that nature in EUR/USD should’ve brought some buyers into the fray. And for a brief period yesterday, it did.
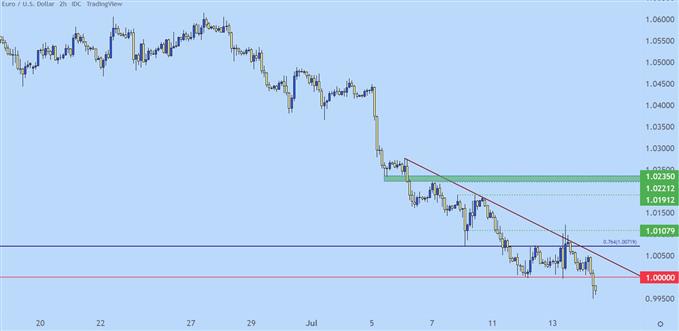
But that’s entirely eroded overnight and as of earlier this morning, EUR/USD was building in a head and shoulders formation, and there was even a hue of a descending triangle in there. That’s now breached and we’re seeing EUR/USD trade at fresh 19-year-lows.
As for next support – that’s a big question. There’s a dearth of historical data from which to take so, generally speaking, I’ll default to psychological levels in this case, looking to the .9900 handle as a spot of interest and there may even be some support showing around 50’s such as .9950 or .9850.
EUR/USD Two-Hour Price Chart
Chart prepared by James Stanley; EURUSD on Tradingview
GBP/USD
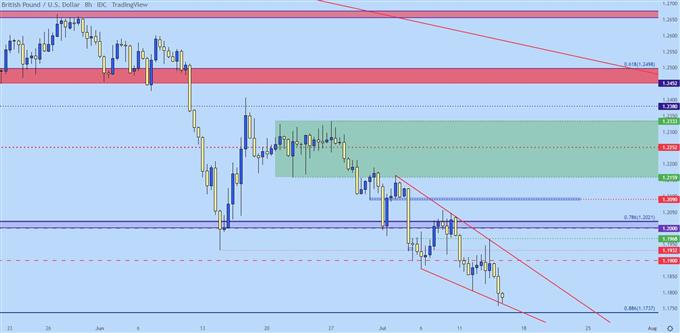
Cable remains in the midst of a sharp move. In the effort of trying to find something on the other side of the USD, I picked out a falling wedge formation here yesterday.
That formation is now being tested at support and a further breach could nullify the formation. As for support, there’s a Fibonacci level a little lower, around 1.1737, which could produce some interest.
GBP/USD Eight-Hour Price Chart
Chart prepared by James Stanley; GBPUSD on Tradingview
USD/CAD Snaps Despite BoC 100 BP Hike
Yesterday produced a surprise as the Bank of Canada hiked rates by 100 basis points. Markets were looking for a 75 bp move but, this was designed to get front-load rate hikes so that the bank could be softer in the future.
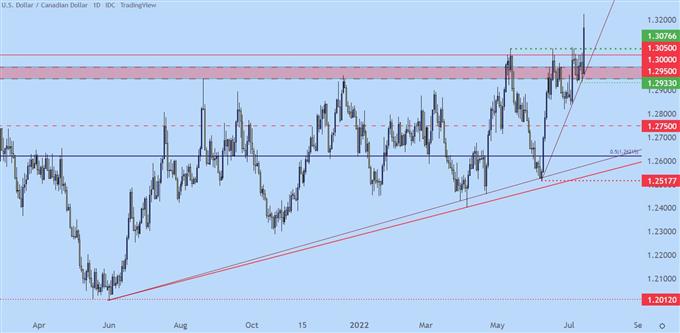
And, as pointed out yesterday, this merely pushed price to a key spot of support around 1.2950. What’s happened since, however, has exceeded even my expectations as price put in a massive reversal that led-in to a breakout to a fresh yearly high. Given the hold of support, the door for bullish strategies remained open given the ascending triangle formation.
Similar to USD above, chasing is rarely a smart way of approaching a market, so that prior double top/triple top at 1.3077 offers support potential for pullback themes.
USD/CAD Daily Price Chart
Chart prepared by James Stanley; USDCAD on Tradingview
USD/JPY Big Breakout
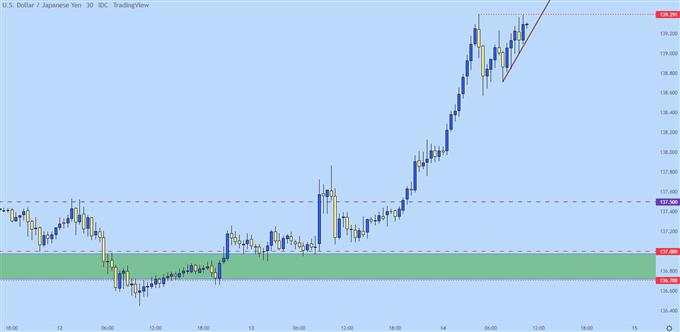
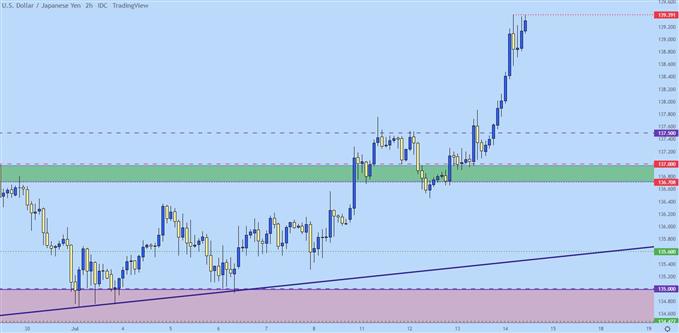
USD/JPY was testing support yesterday as I had highlighted in USD Price Action Setups, and that’s led to another sizable move with USD/JPY now approaching the 140.00 psychological level.
Similar to USD above, I don’t want to try to call a top here. From a short-term basis, the pair appears to be setting up for a breakout with resistance at 139.40, which keeps the door open for a bullish breakout towards the 140.00 psychological level.
USD/JPY 30-Minute Price Chart
Chart prepared by James Stanley; USDJPY on Tradingview
Taking a step back, and we’re pretty far away from any recent support, so trend traders will likely need to exercise some patience in letting higher-low support establish itself. But, the resistance looked at yesterday around 137.50 could remain of interest if a stronger pullback does develop.
USD/JPY Two-Hour Price Chart
Chart prepared by James Stanley; USDJPY on Tradingview
— Written by James Stanley, Senior Strategist for DailyFX.com
Contact and follow James on Twitter: @JStanleyFX


