- US data on Thursday suggested the world’s largest economy was slowing down.
- Fewer Americans than expected filed new claims for unemployment last week.
- Investors will focus on the next Fed meeting in February as they hope for a Fed pause.
Today’s EUR/USD price analysis is slightly bullish. On Friday, the Euro struggled to find direction as concerns about an economic slowdown in the US dampened risk sentiment.
–Are you interested to learn more about low spread forex brokers? Check our detailed guide-
After falling 7.7% in the final three months of 2022, the dollar index is down just 1.3% this year as investors wagered that the Federal Reserve would moderate the rate at which it raises interest rates.
After several significant interest rate increases from the Federal Reserve, a flurry of US data on Thursday suggested the world’s largest economy was slowing down. Traders are hoping for a break in tightening this year.
However, fewer Americans than expected last week filed new claims for unemployment benefits. This suggests that the labor market will remain tight and that job growth will be strong for another month.
The upcoming Fed meeting at the beginning of next month will come into focus for investors. After four straight 75 basis point increases, the central bank increased interest rates by 50 basis points in December, and the market is eagerly awaiting another decrease.
According to ING experts, the concentrated focus on the US economic story leaves the dollar sensitive to data releases as markets keep lowering their expectations for Fed rate hikes.
EUR/USD key events today
Investors will pay attention to the existing home sales report from the US. Existing Home Sales tracks the annualized change in the number of existing residential buildings sold in the previous month.
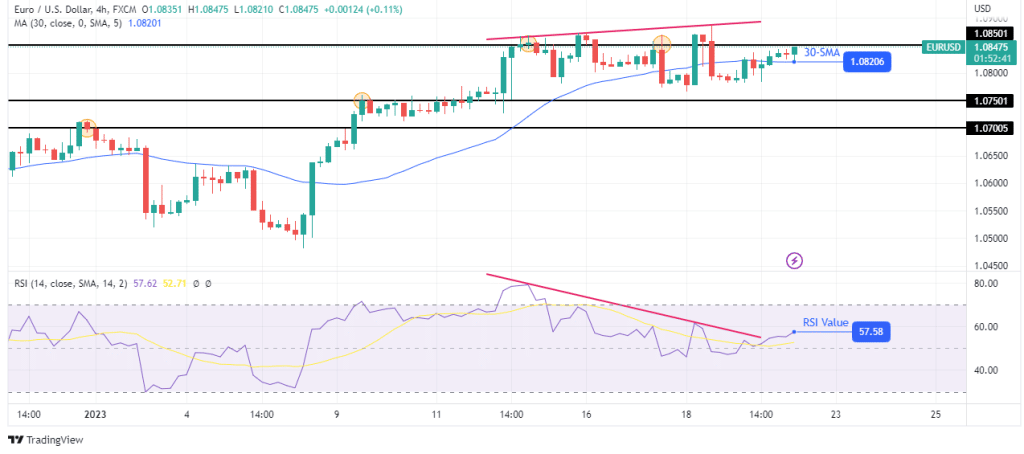
EUR/USD technical price analysis: Bulls run out of steam at the 1.0850 resistance

The 4-hour chart shows EUR/USD moving sideways and chopping through the 30-SMA after finding resistance around the 1.0850 level. The price moves sideways, indicating that bears and bulls are equally matched.
–Are you interested to learn more about forex signals? Check our detailed guide-
A closer look at the RSI reveals a bearish divergence with the price. This is a sign that bulls have weakened, allowing bears to show some strength. However, bears can only take over when the price breaks below the 30-SMA and starts making lower lows and lower highs. This would also mean taking out the 1.0750 and 1.0700 support levels. The bullish trend will continue if the price breaks above the 1.0850 resistance.
Looking to trade forex now? Invest at eToro!
67% of retail investor accounts lose money when trading CFDs with this provider. You should consider whether you can afford to take the high risk of losing your money.


