Euro Talking Points:
- The Euro has shown strength in the aftermath of last week’s FOMC rate decision with the pair making another run towards the 1.1000 psychological level.
- EUR/USD has had one test above the 1.1000 level so far in 2023 and it failed, with sellers showing up at Fibonacci resistance before driving a 500 pip retracement. Support showed up at a key level two weeks ago and bulls have had control since, through both the European Central Bank rate decision and last week’s FOMC meeting.
- I’ll be discussing these themes in-depth in the weekly webinar on Tuesday at 1PM ET. It’s free for all to register: Click here to register.
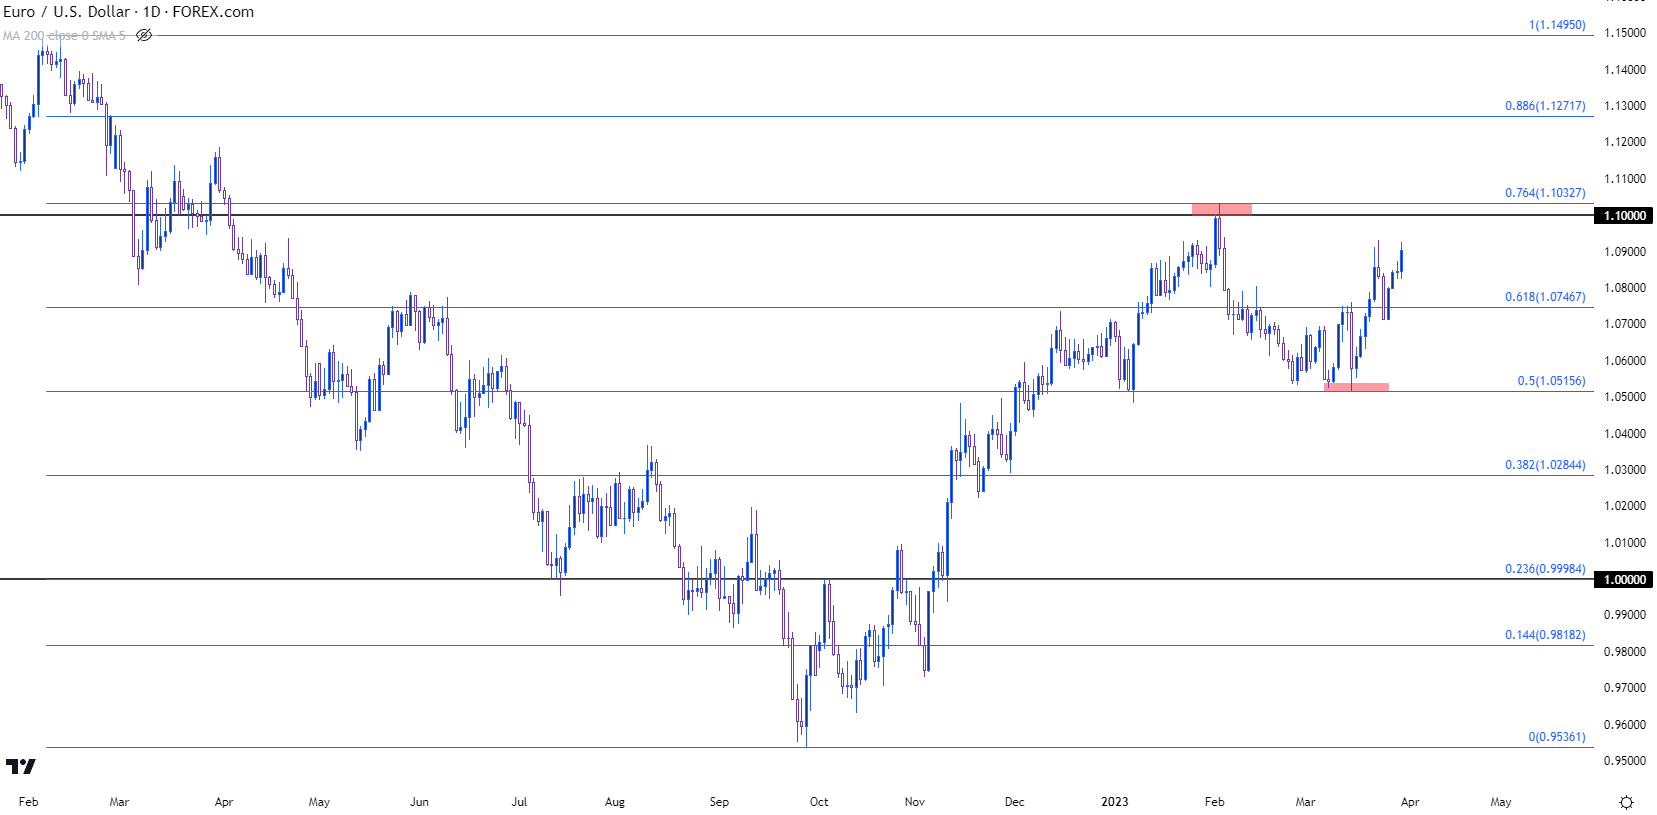
Euro strength continues to show with EUR/USD making another run at the 1.1000 psychological level. This price had come into play briefly in early-February, but bulls began to lose control shortly after. This was on February 2nd with the NFP report released a day after bringing a massive print, which helped to drive USD-strength for much of the next six weeks.
EUR/USD support began to show on March 15th, with buyers appearing after a test of the 50% mark of the Fibonacci retracement produced by last year’s bearish move that spanned from February through September. The 76.4% retracement from that same major move helped to catch the high in early-February, so there’s been some recent interest around that technical study that could remain of interest as prices push closer to a re-test of the 1.1000 psychological level.
EUR/USD Daily Price Chart
 Chart prepared by James Stanley, EUR/USD on Tradingview
EUR/USD Shorter-Term
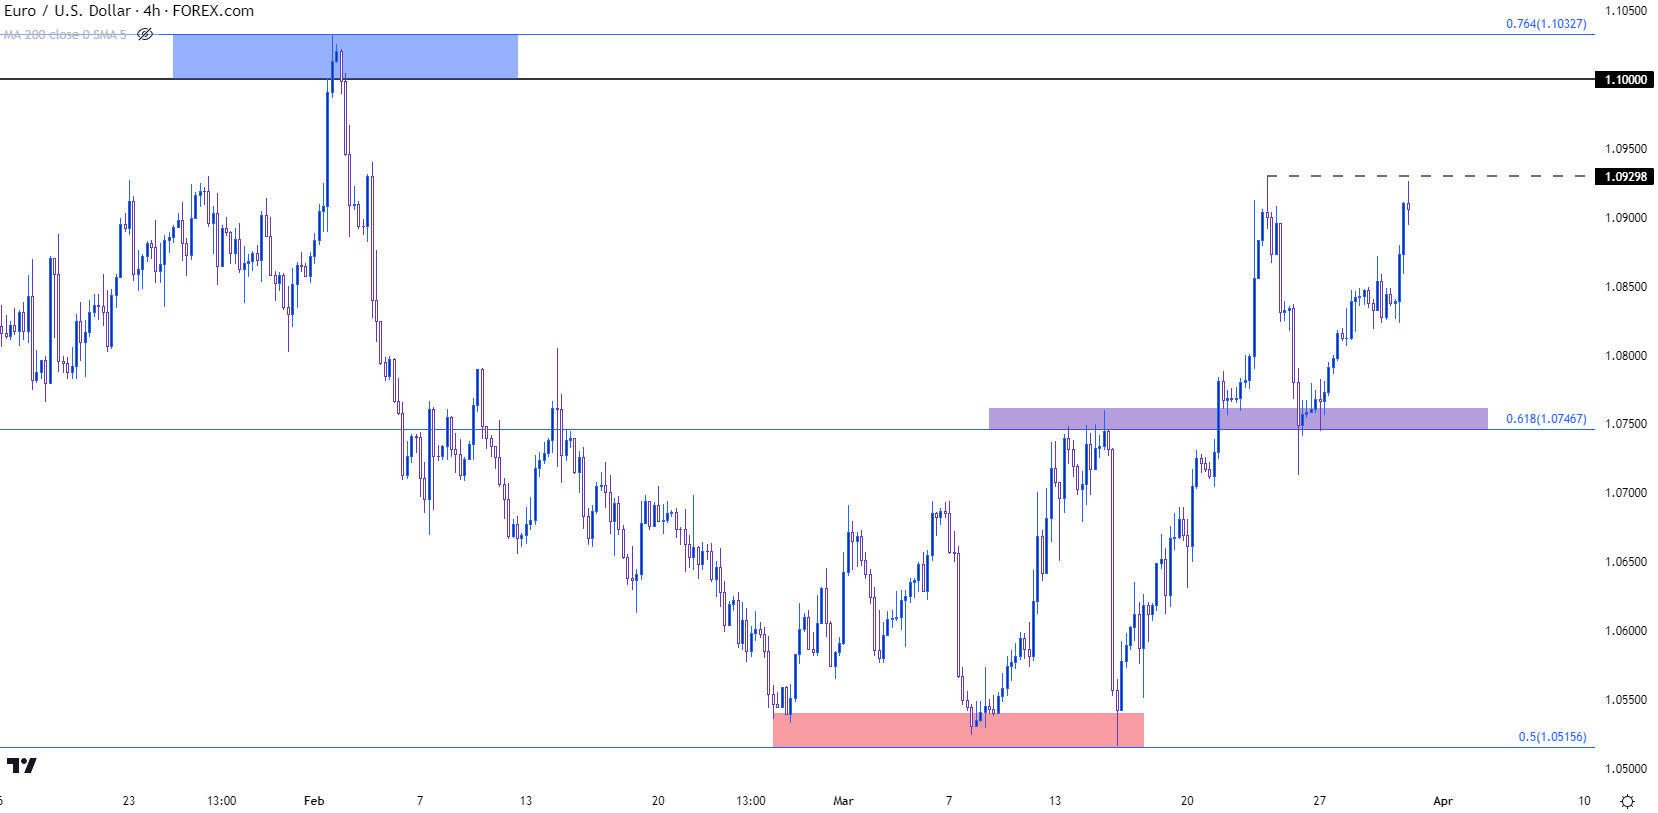
The 61.8% retracement from that study has had some impact on recent market dynamics, as well. This level plots at 1.0747 and this had helped to hold the high two weeks ago before coming in as support towards the end of last week. That support held through this week’s open, with prices launching afterwards, and the pair is now making a fast approach at last week’s high of 1.0930.
EUR/USD Four-Hour Price Chart

Chart prepared by James Stanley, EUR/USD on Tradingview
EUR/USD Strategy
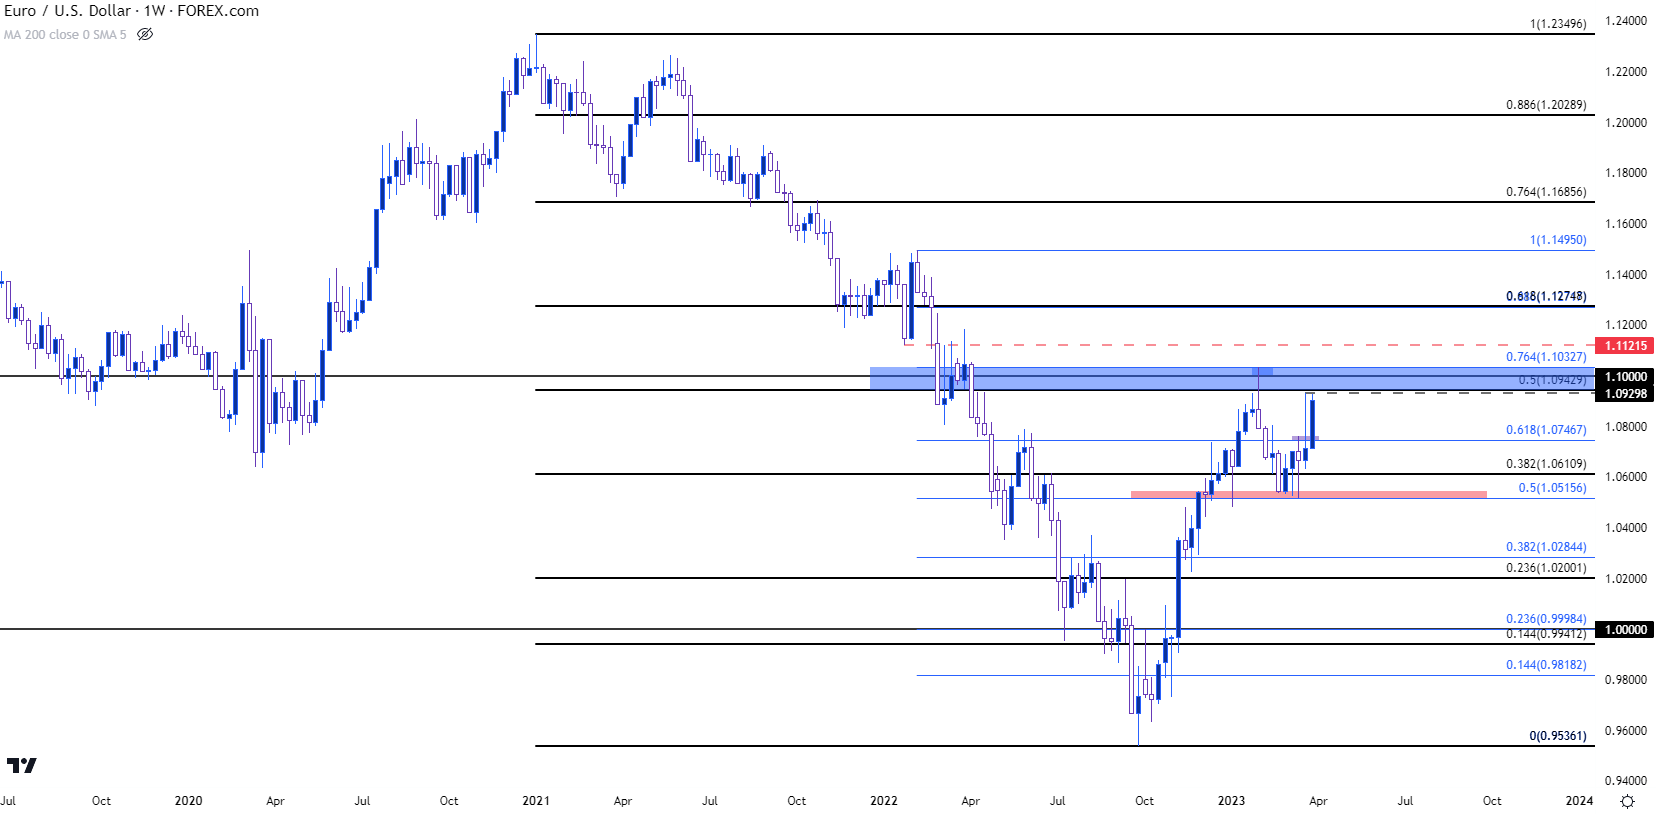
There’s a swath of resistance sitting overhead on the EUR/USD pair and this is something that bulls will have to contend with in the not-too-distant future. Applying a Fibonacci retracement over the 2021-2022 major move highlights the 1.0943 level, very nearby last week’s swing high, as the 50% mark of that major move. But, perhaps more to the point, sellers had an open door to re-take control of the matter through the early-part of March but were unable to make any ground below the 1.0500 psychological level.
This puts focus on another resistance test of the zone sitting overhead, starting at 1.0930 after which 1.0943 and 1.1000 comes into play. If buyers are able to force about that level, 1.1034 would come into view which is currently functioning as the 11-month high in the pair. Above that is an area of support-turned-resistance at 1.1122 that becomes another resistance level of note should bulls make that forward-push.
EUR/USD Weekly Chart
 Chart prepared by James Stanley, EUR/USD on Tradingview
— written by James Stanley, Senior Strategist
Follow James on Twitter @JStanleyFX


