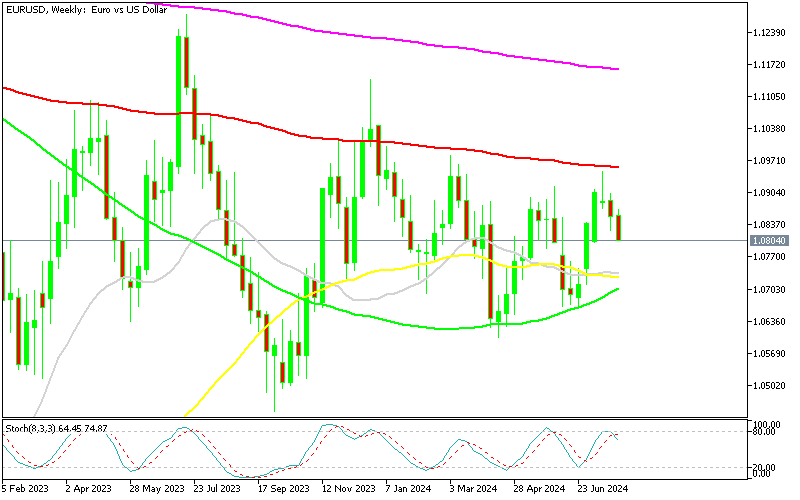
EURUSD has been trading in a range, bouncing between moving averages on the weekly chart, which continues since January 2023. In June this forex pair bounced off the 100 simple MA and gained around 300 pips, while in July the price has been reversing lower and buyers are giving back the gains and the price heads for the bottom of the range.
EUR/USD Chart H4 – MAs Are Getting Broken
Eurozone Economic Outlook and EUR/USD Price Action
After the latest European Central Bank (ECB) meeting, we anticipated that the EUR/USD exchange rate would move closer to 1.08 rather than approaching the key 1.10 level, particularly given the worsening economic outlook for the Eurozone. This outlook was confirmed today by the BCA, which indicated that the Eurozone economy is heading into a recession. The EUR/USD pair, which surged nearly 3 cents from late June to mid-July, has since been reversing lower and is now nearing the 1.08 mark. This movement was primarily due to USD weakness in the second week of July, which brought the pair close to 1.0950. However, without strong bullish catalysts for the Euro, the pair’s price faced resistance at the 100 weekly SMA (red), resulting in a reversal. Over the past two weeks, the EUR/USD has been trending downwards, currently targeting the 100 weekly SMA (green) around the 1.07 level.
Market Volatility and Currency Prediction
Yesterday, the euro reached its lowest point since July 8 as the US dollar strengthened across the board. The immediate drivers behind these movements were unclear at the time, but stronger-than-expected US GDP figures for Q2 and higher PCE inflation were likely contributing factors. Despite this, there hasn’t been significant movement in Fed pricing, and Treasury yields have remained relatively stable. Additionally, as the month ends, various cash flows are influencing price actions in financial markets, adding to the volatility.
EUR/USD Live Chart
EUR/USD


