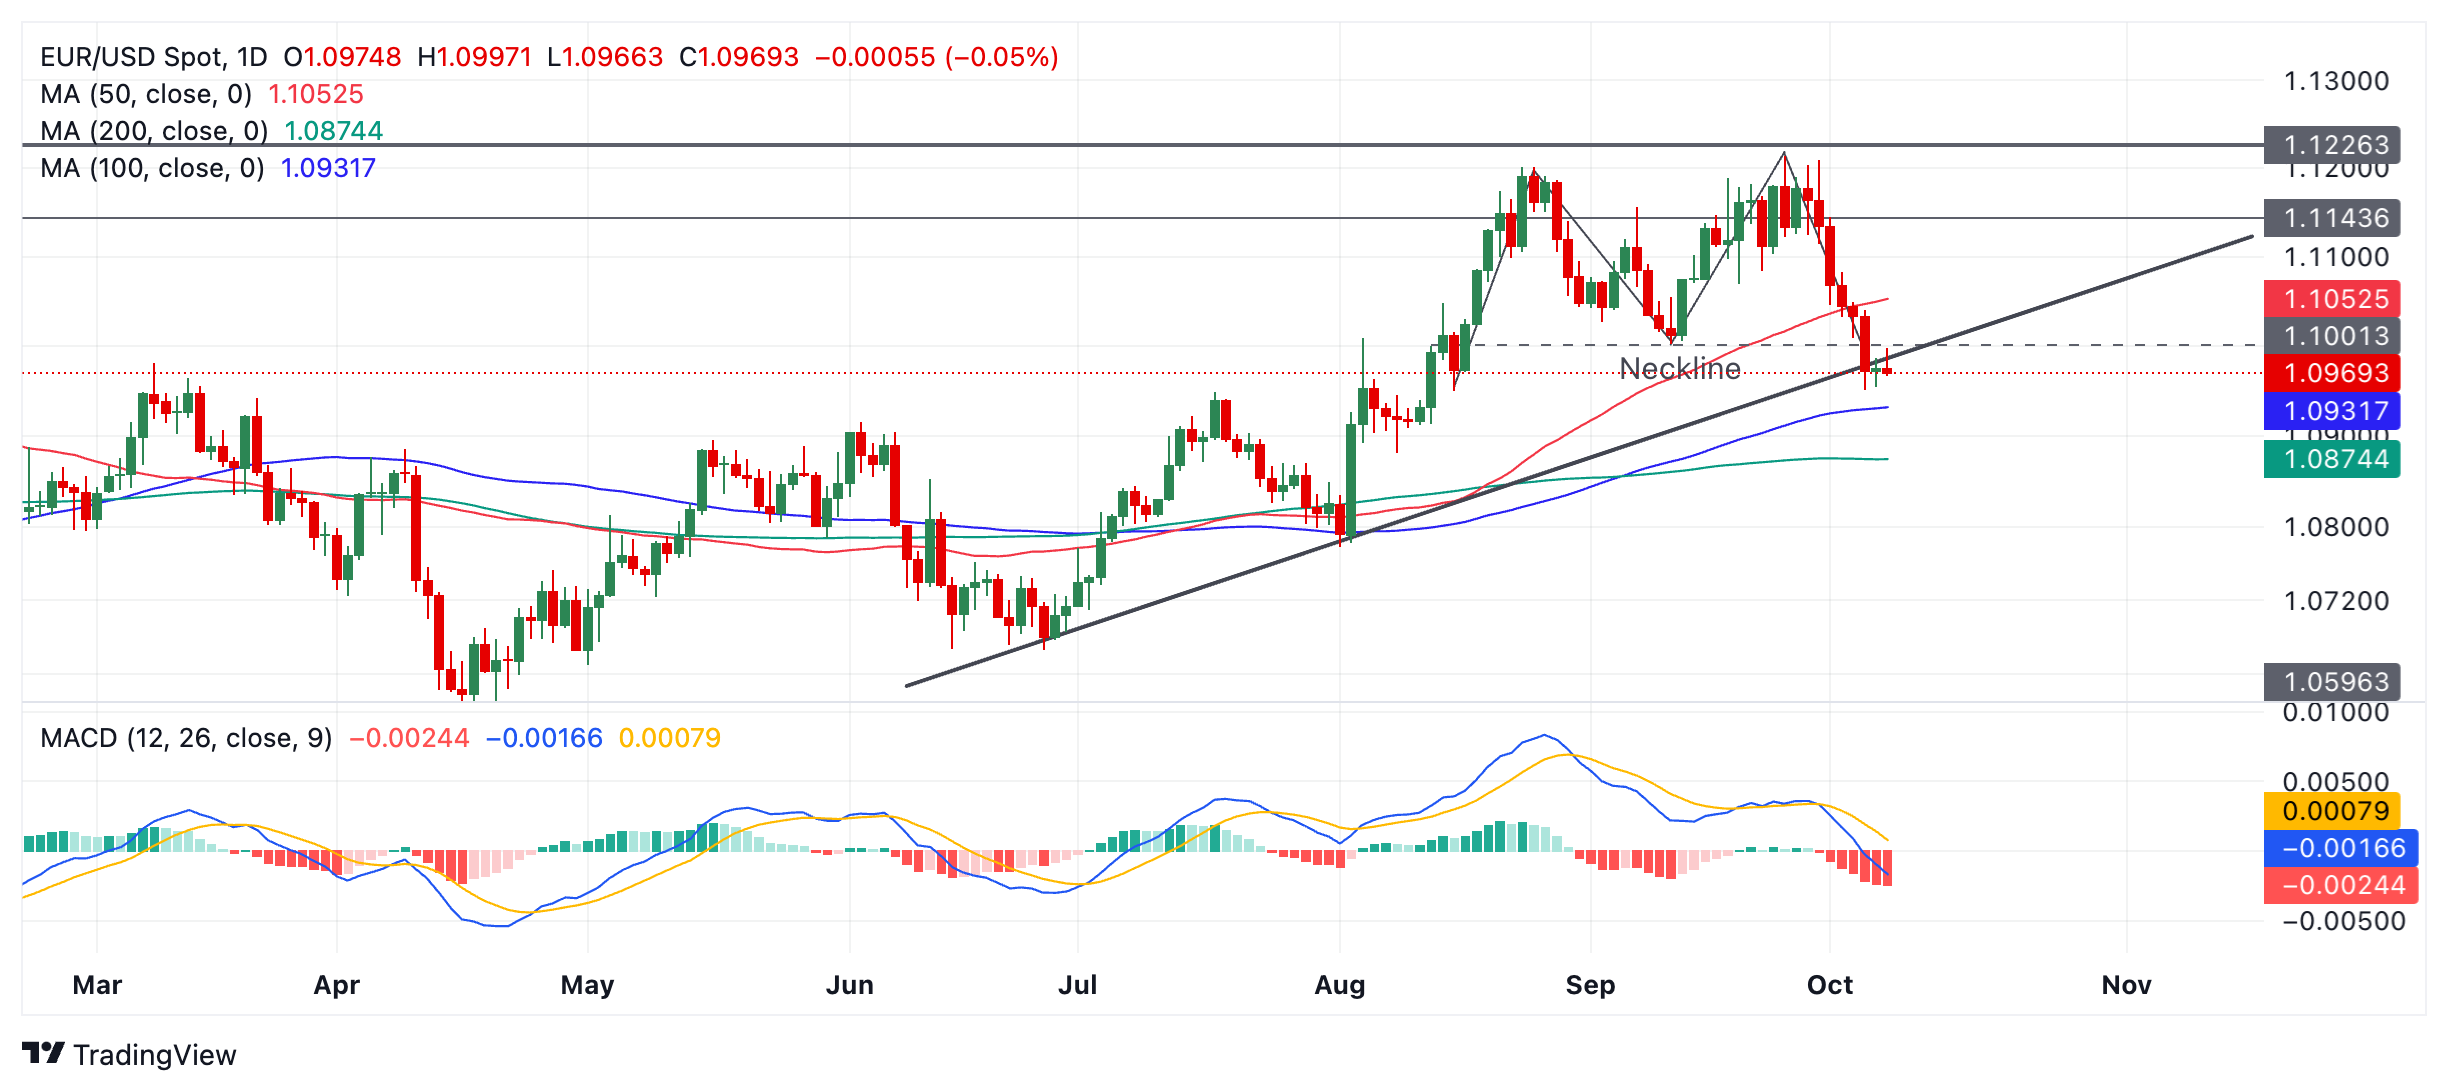
- EUR/USD has broken below a key trendline and might have formed a bearish pattern.
- A Double Top reversal pattern could potentially be a bad omen for the pair.
EUR/USD breaks below the trendline for the rally since June. On Tuesday it executes a throwback move to “air kiss the trendline goodbye” and now seems to be declining again.
The overall tenor of the chart suggests a bearish short-term outlook. Momentum as measured by the Moving Average Convergence Divergence (MACD) is in negative territory. If prices can close below Friday’s low at 1.0951 the break will be confirmed and a deeper decline is likely to unfold.
EUR/USD Daily Chart
A confirmed break of the trendline would likely lead to a deeper sell-off. Such a move might reach a target at 1.0865 initially (the 61.8% Fibonacci (Fib) extrapolation of the move prior to the trendline break). The 200-day Simple Moving Average (SMA), however, could come in with support a little before then at 1.0875, suggesting another more conservative option.
Adding to the bearish picture is the possible Double Top price pattern which might have formed during September. This is the “M” shaped pattern formed just under the heavy resistance line at 1.1226. Double Tops are signals that the uptrend has reached its conclusion and price is reversing. The pattern’s “neckline” at 1.1001 has already been broken, confirming activation of the pattern’s downside target at 1.0858, the 61.8% Fib extrapolation of the height of the pattern lower.


