- EUR/USD fluctuates above 1.0800 after posting considerable gains on Thursday.
- The pair’s near-term outlook points to a bullish tilt.
- The 200-day SMA aligns a significant resistance at 1.0870.
EUR/USD gathered bullish momentum and closed in positive territory above 1.0800 on Thursday, snapping a three-day losing streak in the process. Although the pair struggles to extend its recovery early Friday, the near-term technical outlook suggests that sellers remain on the sidelines for the time being.
The improving risk mood, combined with a pullback in the US Treasury bond yields, caused the US Dollar (USD) to lose interest on Thursday, allowing EUR/USD to stretch higher. Early Friday, US stock index futures trade virtually unchanged on the day, pointing to a neutral risk stance and limiting the pair’s upside.
In the second half of the day, the US economic calendar will feature Durable Goods Orders data for September. Markets expect a 1% decline on a monthly basis. A positive reading could support the USD with the immediate reaction, while a bigger-than-forecast drop could have the opposite impact on the currency’s valuation. Nevertheless, the market reaction is unlikely to be long-lasting, or significant enough to provide directional momentum to EUR/USD.
Investors will also pay close attention to changes in risk perception heading into the weekend. In case risk flows continue to dominate the action in financial markets, the USD could stay on the back foot.
EUR/USD Technical Analysis
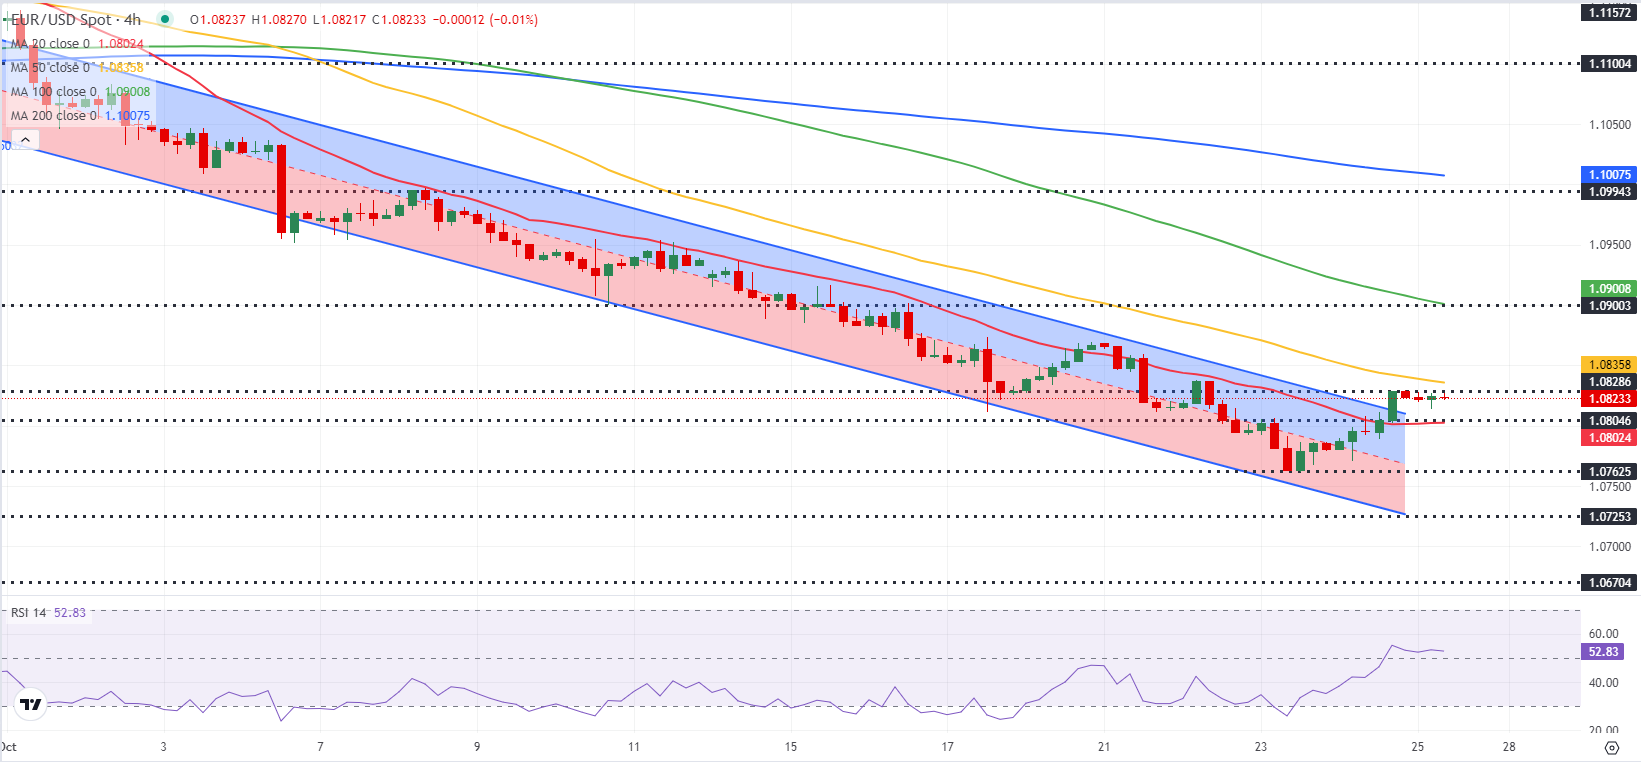
EUR/USD broke out of the descending regression channel and stabilized above the upper limit of the channel. Additionally, the Relative Strength Index (RSI) indicator on the 4-hour chart rose above 50 in nearly a month, reflecting a bullish tilt in the near-term outlook.
The 50-period Simple Moving Average (SMA) aligns as interim resistance at 1.0835 before 1.0870 (200-day SMA). In case EUR/USD rises above the latter and stabilizes there, technical buyers could show interest and open the door for another leg higher toward 1.0930, where the 100-day SMA is located.
Looking south, supports could be located at 1.0800 (static level), 1.0760 (static level) and 1.0700 (static level, round level).


